

September’s Calendar Cruelty for Stocks
The difficult 2022 for stocks may not get much easier because as we now wait for better news on the inflation front, we have to contend with a seasonally weak month of September. While we got some welcome news in Friday’s jobs report, more evidence of falling inflation will take time to materialize. The good news is a seasonally strong fourth quarter is right around the corner. If history is a guide, midterm elections may provide an added late-year boost.
September to remember?
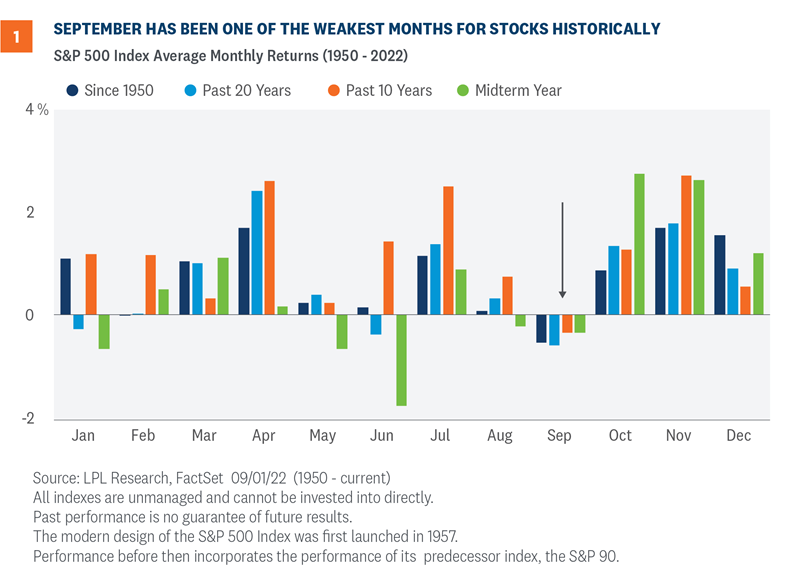
September is often a month to remember for investors—but for the wrong reasons. September has historically been one of the weakest months of the year for stocks, as shown in Figure 1.
Here are some numbers to illustrate the consistency of this seasonal pattern:
- Since 1950, the S&P 500 Index has averaged a 0.54% decline in September, the worst of all 12 months.
- Over the past 20 years, September is still the worst month for stocks with an average decline of 0.6%, but January and June are close behind with average losses of 0.28% and 0.38%, respectively.
- Over the past 10 years, September is the only month when the S&P 500 averages a loss (0.35%).
- During midterm years the S&P 500 has averaged a 0.35% decline in September, though that ranks ninth and is better than January (-0.66%), May (-0.66%), and June (-1.76%).
- These negative seasonal effects are exacerbated when the index is down on a year-to-date basis heading into the month. When the S&P 500 has been down year to date through August (as it is this year), the index has averaged a decline of 3.4% in September (source: Bespoke Investment Group).
This isn’t a very uplifting message but consider that October is right around the corner and that month kicks off a string of some of the best months of the year for stocks. In fact, during midterm election years, the best three months of the year have been October, November, and December. The average midterm year gains for the S&P 500 over the final three months are 2.7%, 2.6%, and 1.2%, with gains 72%, 78%, and 67% of the time.
Stocks could likely hang in there for the next 24 days and then stage a strong fourth quarter rally. Based on history, that seems like a reasonable expectation.
Some welcomed relief from friday’s jobs report
Investors were ushered into their holiday weekends with a really nice jobs report. August payrolls increased by 315,000, right in line with consensus, while the unemployment rate ticked up slightly to 3.7%.
The labor market is moving in the right direction for policy makers. An uptick in unemployment along with a modest increase in the participation rate means that the labor market in August was less tight than it was in July. That’s what the Federal Reserve (Fed) wants to see.
We believe markets interpreted the jobs report correctly in rallying Friday morning given the broad-based gains in jobs as both goods-producing and services jobs rose in August. Although those early Friday gains didn’t hold, evidence of slightly less wage pressure in the report and some steepening of the U.S. Treasury 2 year-10 year yield curve were also encouraging. Odds of another 75 basis point rate hike from the Fed have come down but 50 vs. 75 is still a close call.
One caution flag waving right now is the rise in part-time workers who otherwise would be interested in full-time work. The economy is now employing more workers in temporary help services than ever before, and this could be a cause for concern. Businesses often begin cutting these jobs during periods of economic uncertainty and an increasingly large number of individuals in these roles is inherently unstable for the labor market.
Technical analysis perspective
Looking at the technicals for the S&P 500, the selling pressure has certainly been strong since Fed Chair Jerome Powell gave his “there is no pivot” speech at the Jackson Hole symposium.
In the weeks prior to the speech, there had been some important signals of potential technical strength looking forward. Among them was the S&P 500 retracing more than 50% of the bear market decline and the strong breadth reading with over 90% of S&P 500 stocks above their 50-day moving average. Both metrics have solid historical records as signals of better times ahead.
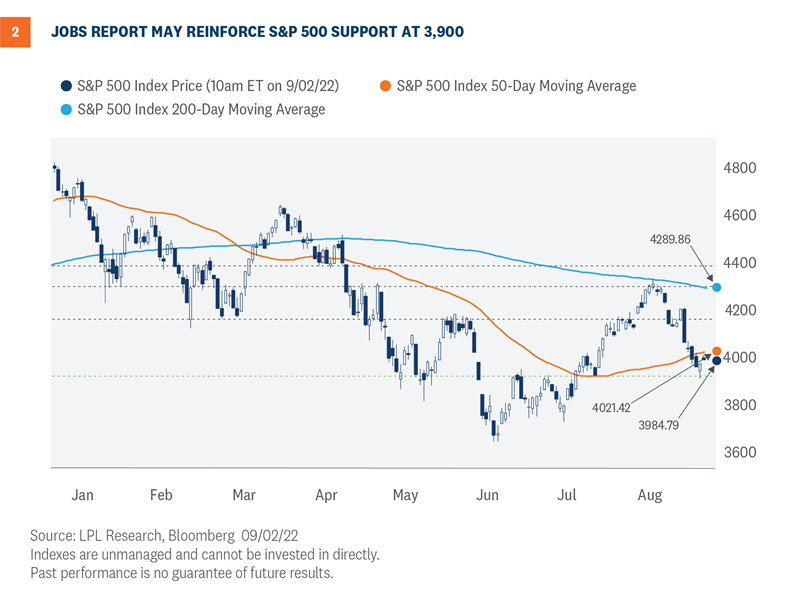
At the same time, however, we believed the upward move the index made starting with the July 19 breakout was so strong that a move lower to consolidate gains was likely. On a reversal, we saw strong support around 3,900 [Figure 2]. This level was slightly below an upward-sloping 50-day moving average, which sometimes itself acts as support, and also captured the May lows, the June highs, and a percentage level of the recent gains that often provides support. If the S&P 500 breaks down from 3,900, the next key level is the bear market low of 3,666 reached on June 16.
We believe the technical picture still supports stocks moving higher by year end, but the strength of the selling pressure during the downward move raises the prospect of increased risk and a more volatile path.
Conclusion
So will this September be another struggle? The combination of peak hawkishness from the Fed and the frustratingly slow pace at which inflation is cooling could continue to weigh on stocks for another month or more. Meanwhile, earnings season is no longer available as a potential positive market catalyst, Europe’s energy crisis is worsening, and COVID-19-related lockdowns in China are continuing.
Still, we could see potential upside for stocks over the balance of 2022. Some inflation relief is likely coming, which can help foster interest rate stability. Friday’s jobs report that many are calling “Goldilocks,” sets up some needed cooling of labor markets. Corporate America continues to show its resilience. Stocks tend to finish midterm election years with strong gains.
However, we do recognize that in the very short term the market’s direction will likely depend on when the Fed signals its rate hiking campaign will slow. We likely have to wait at least another month for that and probably more.
We maintain our year-end fair value S&P 500 target at 4,300-4,400, based on a price-to-earnings ratio of 18-19 times our $235 EPS estimate for 2023. In a soft-ish landing scenario, perhaps a 50/50 proposition currently (odds inched higher post-jobs report), we see upside to that target range. On the flip side, a potential Fed policy mistake, a possible recession in 2023, and heightened geopolitical tensions present risks to the downside.
You may also be interested in:
- Earnings Recap: Still Hanging In There – August 29, 2022
- Home Sales Fall (Again). What’s Next? – August 22, 2022
- Is This the Start of a New Bull Market? – August 15, 2022
Jeffrey Buchbinder, CFA, Chief Equity Strategist, LPL Financial
Barry Gilbert, PhD, CFA, Asset Allocation Strategists, LPL Financial
Jeffrey Roach, PhD, Chief Economist, LPL Financial
______________________________________________________________________________________________
IMPORTANT DISCLOSURES
This material is for general information only and is not intended to provide specific advice or recommendations for any individual. There is no assurance that the views or strategies discussed are suitable for all investors or will yield positive outcomes. Investing involves risks including possible loss of principal. Any economic forecasts set forth may not develop as predicted and are subject to change.
References to markets, asset classes, and sectors are generally regarding the corresponding market index. Indexes are unmanaged statistical composites and cannot be invested into directly. Index performance is not indicative of the performance of any investment and does not reflect fees, expenses, or sales charges. All performance referenced is historical and is no guarantee of future results.
Any company names noted herein are for educational purposes only and not an indication of trading intent or a solicitation of their products or services. LPL Financial doesn’t provide research on individual equities.
All information is believed to be from reliable sources; however, LPL Financial makes no representation as to its completeness or accuracy.
The Standard & Poor’s 500 Index (S&P500) is a capitalization-weighted index of 500 stocks designed to measure performance of the broad domestic economy through changes in the aggregate market value of 500 stocks representing all major industries.
The PE ratio (price-to-earnings ratio) is a measure of the price paid for a share relative to the annual net income or profit earned by the firm per share. It is a financial ratio used for valuation: a higher PE ratio means that investors are paying more for each unit of net income, so the stock is more expensive compared to one with lower PE ratio.
Earnings per share (EPS) is the portion of a company’s profit allocated to each outstanding share of common stock. EPS serves as an indicator of a company’s profitability. Earnings per share is generally considered to be the single most important variable in determining a share’s price. It is also a major component used to calculate the price-to-earnings valuation ratio.
All index data from FactSet.
This research material has been prepared by LPL Financial LLC.
Securities and advisory services offered through LPL Financial (LPL), a registered inv estment advisor and broker -dealer (member FINRA/SIPC). Insurance products are offered through LPL or its licensed affiliates. To the extent you are receiving investment a dvice from a separately registered independent investment advisor that is not an LPL affiliate, please note LPL makes no representation with respect to such entity.
| Not Insured by FDIC/NCUA or Any Other Government Agency | Not Bank/Credit Union Guaranteed | Not Bank/Credit Union Deposits or Obligations | May Lose Value |
RES-1258500-0922 | For Public Use | Tracking # 1-05322844 (Exp. 09/23)